![]()
Your credit score can have a serious impact on your ability to make major purchases, obtain competitive insurance rates, avoid rental and utility deposits, and even qualify for a new cell phone. With so much riding on this magic number, we decided to dig a little deeper to find out what scores look like across the nation and what you can do to raise your own credit score.
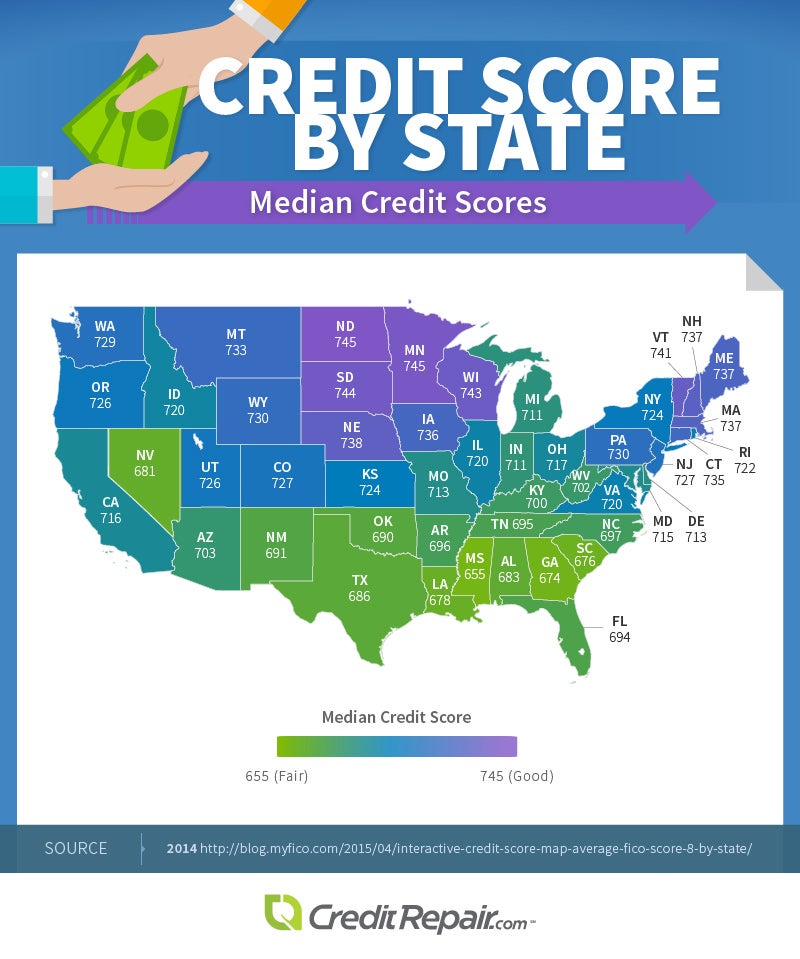
Median Credit Scores by State
Median credit scores by state range anywhere from 655 (fair) to 745 (good). When visualized over a map of the United States, it becomes obvious that scores are not grouped randomly. Southern states and part of the Great Lakes region are home to lower scores than most of the rest of the country. How can such a clear demarcation exist? Exploring several socioeconomic factors can shed some light on the situation.

Credit Scores by Job and Education
Sorting by job type brings about more questions than answers. Several of the lower-scoring states are home to an above-average number of blue-collar jobs, but not all of them. Perhaps this speaks to idea that there are both high- and low-paying jobs in both categories, and economic pressures related to debt affect workers of all kinds.
Educational attainment presents a stronger correlation with median credit scores. States with the lowest number of residents holding Bachelor’s degrees or higher include West Virginia, Arkansas, Mississippi, Kentucky, Louisiana, Nevada, and Alabama – all low credit score states. The most-educated states – Massachusetts, Colorado, Maryland, Connecticut, New Jersey, Virginia, and Vermont – all have median scores above 700.
Certainly, one would expect income to correspond closely with credit scores. While income metrics are many and varied, one way to understand income levels is to study the percentage of people living in poverty in each state. This is representative of many socioeconomic factors, including income, cost of living, and generational wealth. Indeed, the map below shows that, with the exception of D.C., many of the most impoverished states possess remarkably low median credit scores.
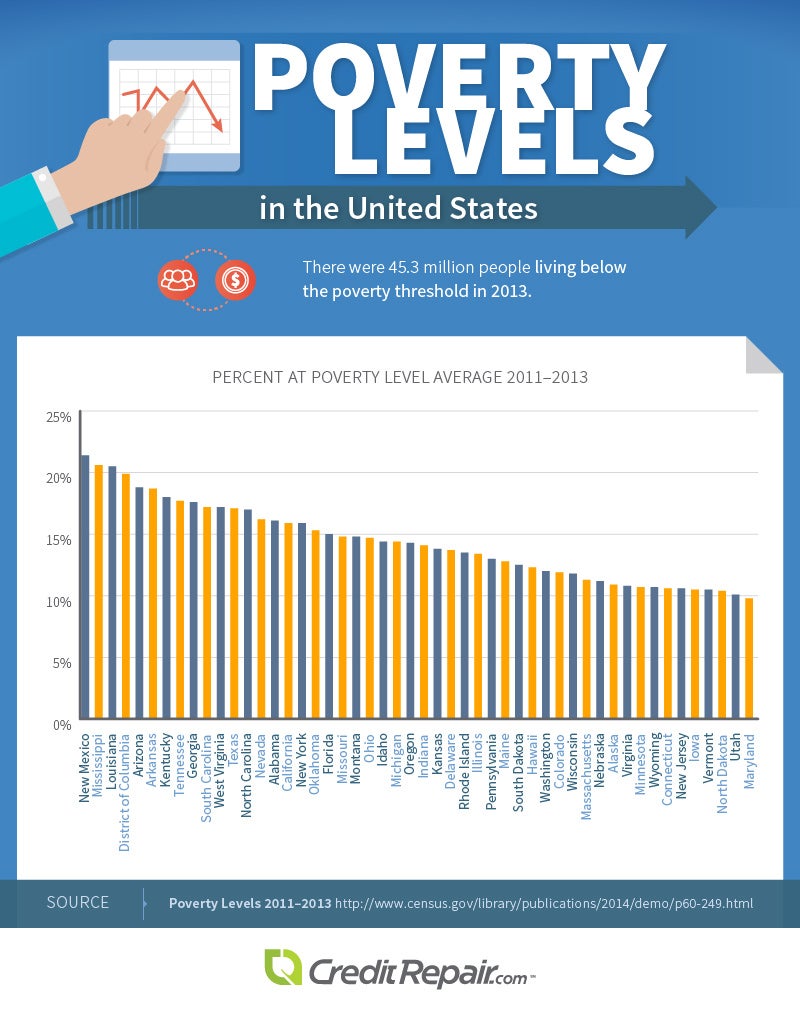
Credit Scores and Poverty Levels
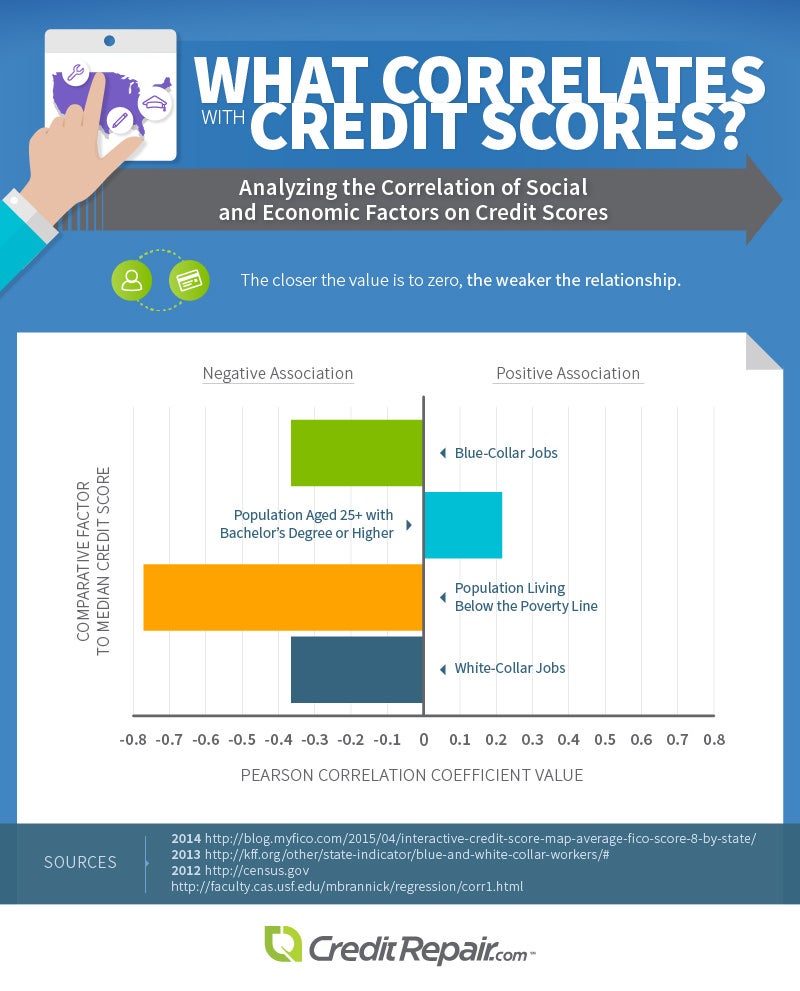
Let’s look at the factors surveyed thus far and their relationship with credit scores more holistically. Beyond the specific realities of each state, what’s the larger statistical picture? In the graphic below, we’ve presented the Pearson Correlation Coefficient Value – the mathematical indicator of a correlation’s strength – to compare how closely each socioeconomic consideration coincides with credit score trends. Unsurprisingly, poverty has the strongest inverse correlation with higher credit scores (the lower the credit score, the higher the poverty level and vice versa), whereas the other factors have only modest statistical relationships with median credit scores numbers.
By now you should be getting the picture. Median credit scores, in large part, reflect a person’s ability to use credit responsibly. This ability is directly influenced by access to education, economic opportunity, historical attitudes toward credit usage, changing economic circumstances, and financial support structures – to name a few. Growing up without an understanding of how to use credit responsibly, and in an area full of economic hardship, could statistically reduce your odds of successfully managing your credit.
Fortunately, there is hope for anyone wishing to improve his or her credit score. It starts with a better understanding of how credit scores are calculated and how one can use that knowledge to move the needle in the right direction.
Consider, for example, the distribution of credit scores by age in the United States. You’ll notice that the older people get, the more likely they are to have a much better score:
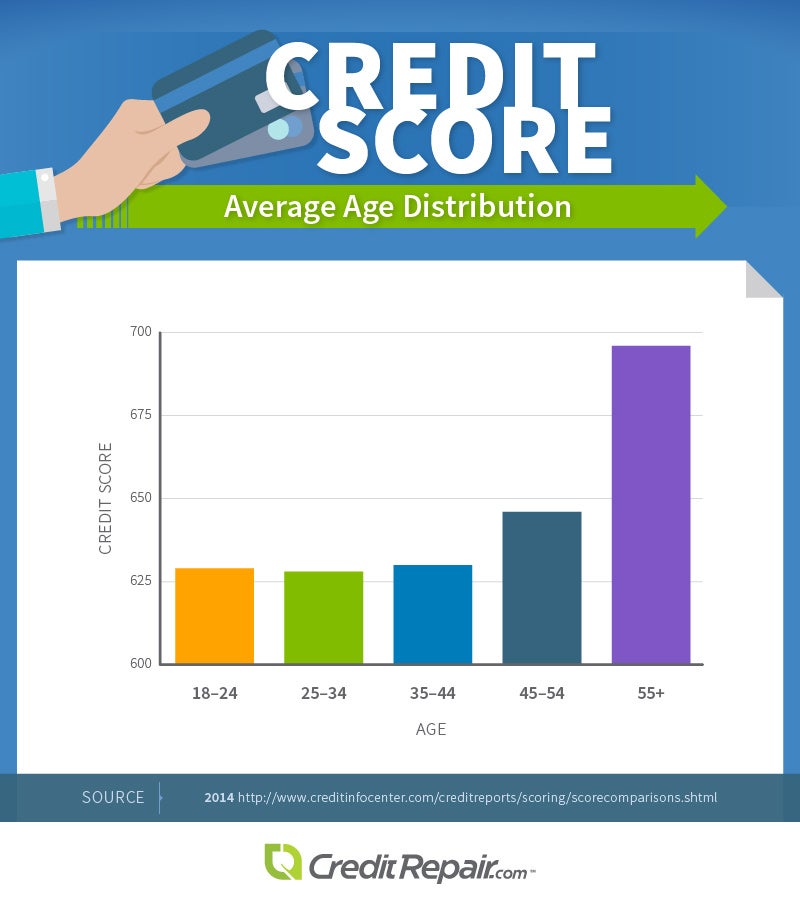
Age, for several reasons, does directly impact your score. When your FICO score is calculated, 15% of the weight is associated with the average length of all of your open accounts. A longer average credit history is better, which obviously slants things in favor of the elderly. Younger people can leverage this knowledge by maintaining a variety of credit accounts over time. Closing an unused credit card can actually hurt your score, as it will no longer contribute positively to your open account age average, so it is wise to consider keeping them open. If your card carries an annual fee and that’s the catalyst for wanting to close the account, call the credit card company and ask them to waive it.
Another major factor in your credit score is the amount you owe across all of your accounts. This isn’t quite as simple as it sounds up front, but there are some general concepts that are easily understood. If you are paying down loans, the difference between the original borrowed amount and the current balance shows an ability to meet your obligations. Credit card utilization is another factor. Maxed-out cards are a sign of trouble, and even if you pay off your balances in full every month, it is quite possible that your balances report before your payments, creating the illusion that you rely on debt more than you really do. Paying down balances, using credit cards less frequently, or even increasing your credit limit can all positively impact your score.
Newly established credit and which types of credit you use account for another 20% of your score. Opening new accounts often can negatively impact your score. Only run credit checks and open new accounts if you have good reason to do so. These new accounts can begin positively contributing to your score, but moderation is the key here. It also helps to have a variety of accounts, such as revolving loans and credit cards, instead of relying solely on one type of credit.
Finally, the most critical factor in your credit score is your payment history. It represents a whopping 35% of your overall score, as it directly reflects your ability to repay – a major risk factor. Simply put, it is extremely important to pay back loans and credit cards on time. Time, frequency, and severity of late payments are all factored. If you’ve struggled to keep up with payments in the past, it is likely hurting your score; however, these can be overcome with time if no additional late payments are made.
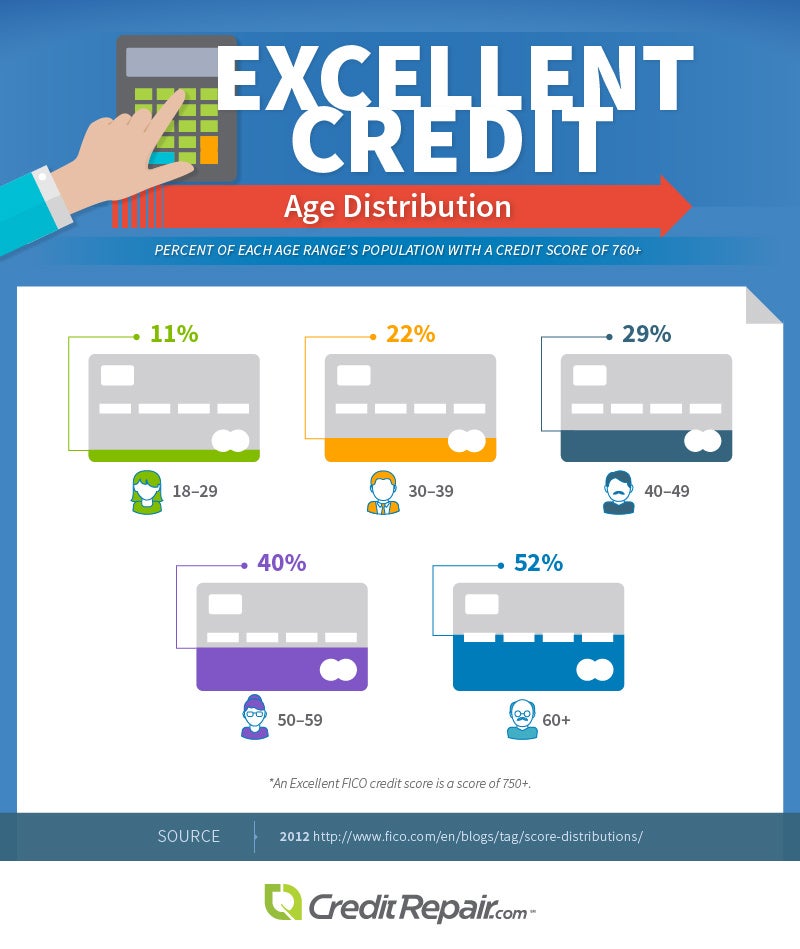
Stability and overall responsible credit usage can very well be associated with age. A review of those in the highest credit score range shows a healthy increase as people get older. Not only does it show that older people are often in a better position financially, but it is proof that with time and good credit practices, it is possible to erase mistakes of the past.
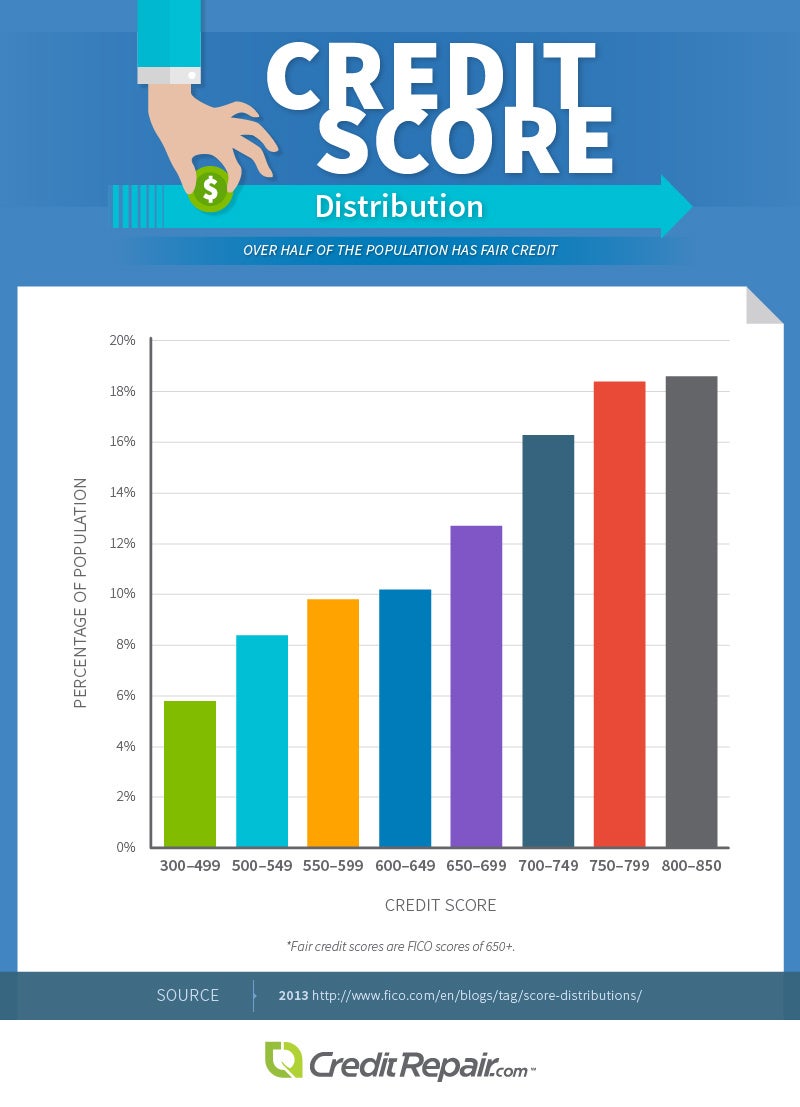
The overall credit picture for the nation is, however, generally positive. Over half of the country has a credit score of fair or better, with the two highest ranges representing more people than any other. This indicates that despite the many challenges, responsible credit use is alive and well in the United States. For those suffering from poor credit scores, an effective credit repair plan could be just what is needed to turn things around.
Just how important is a good credit score? Very. In one example, a person with a 700 credit score buying a $200,000 home with a 30-year fixed mortgage pays almost $59,000 less in interest than someone with a 630 score over the life of the loan. That’s over a quarter of the original purchase price! Simply put, there’s a lot of your hard-earned money at stake when it comes time to borrow. Don’t wait until your next major purchase to start improving your score. The pros at CreditRepair.com make the process easy and help ensure that the next time you borrow money, you will be the one with the advantage!
Methodology and Sources:
For Credit Score by State we used FICO.
For Credit Scores vs. Job Level & Education: We used data from the Kaiser Family Foundation, the U.S. Census Bureau, and FICO.
For What Correlates with Credit Scores? We used the Pearson product-moment correlation coefficient formula to determine how closely each socioeconomic factor related to credit scores. When the value is negative, this means that if there is a correlation, that one value will rise as the other value falls, as we saw with poverty and credit scores. When there is a positive value, if there is a correlation, this means that both factors will rise together. The closer the value is to zero, the weaker the relationship.
For Credit Scores Age Distribution, 2014: We used data from Credit InfoCenter.
For Excellent Credit Age Distribution, 2012 and Credit Scores Distribution by Score Range, 2013: We again used data from FICO.
For Poverty Levels in the United States, 2011–2013: We used data from the U.S. Census Bureau and the U.S. Department of Health and Human Services.
Fair Use Statement
Feel free to share the images found on this page freely. When doing so, we ask that you please attribute the authors of this project by providing your readers with a link back to this page. This will allow readers to learn more about the research and methodology behind the project.
Sources:
https://www.fico.com/blogs/deep-dive-distribution-fico-score-across-us
https://kff.org/other/state-indicator/blue-and-white-collar-workers/#
https://census.gov
https://www.creditinfocenter.com/creditreports/scoring/scorecomparisons.shtml
https://www.census.gov/library/publications/2014/demo/p60-249.html
https://aspe.hhs.gov/2013-poverty-guidelines
https://www.wallstreetmojo.com/pearson-correlation-coefficient