
Wondering which demographics earn the most, or how your salary stacks up against others in your state? Using the U.S. Census Bureau’s figures, we broke down income data to find trends by age, race, gender, education, and region – and the results may reshape the way many look at earning potential in America.
Find out if some financial myths are true, and view our graphics and interactive features below to see where you fall on the income scale.
Age, Race, and Income
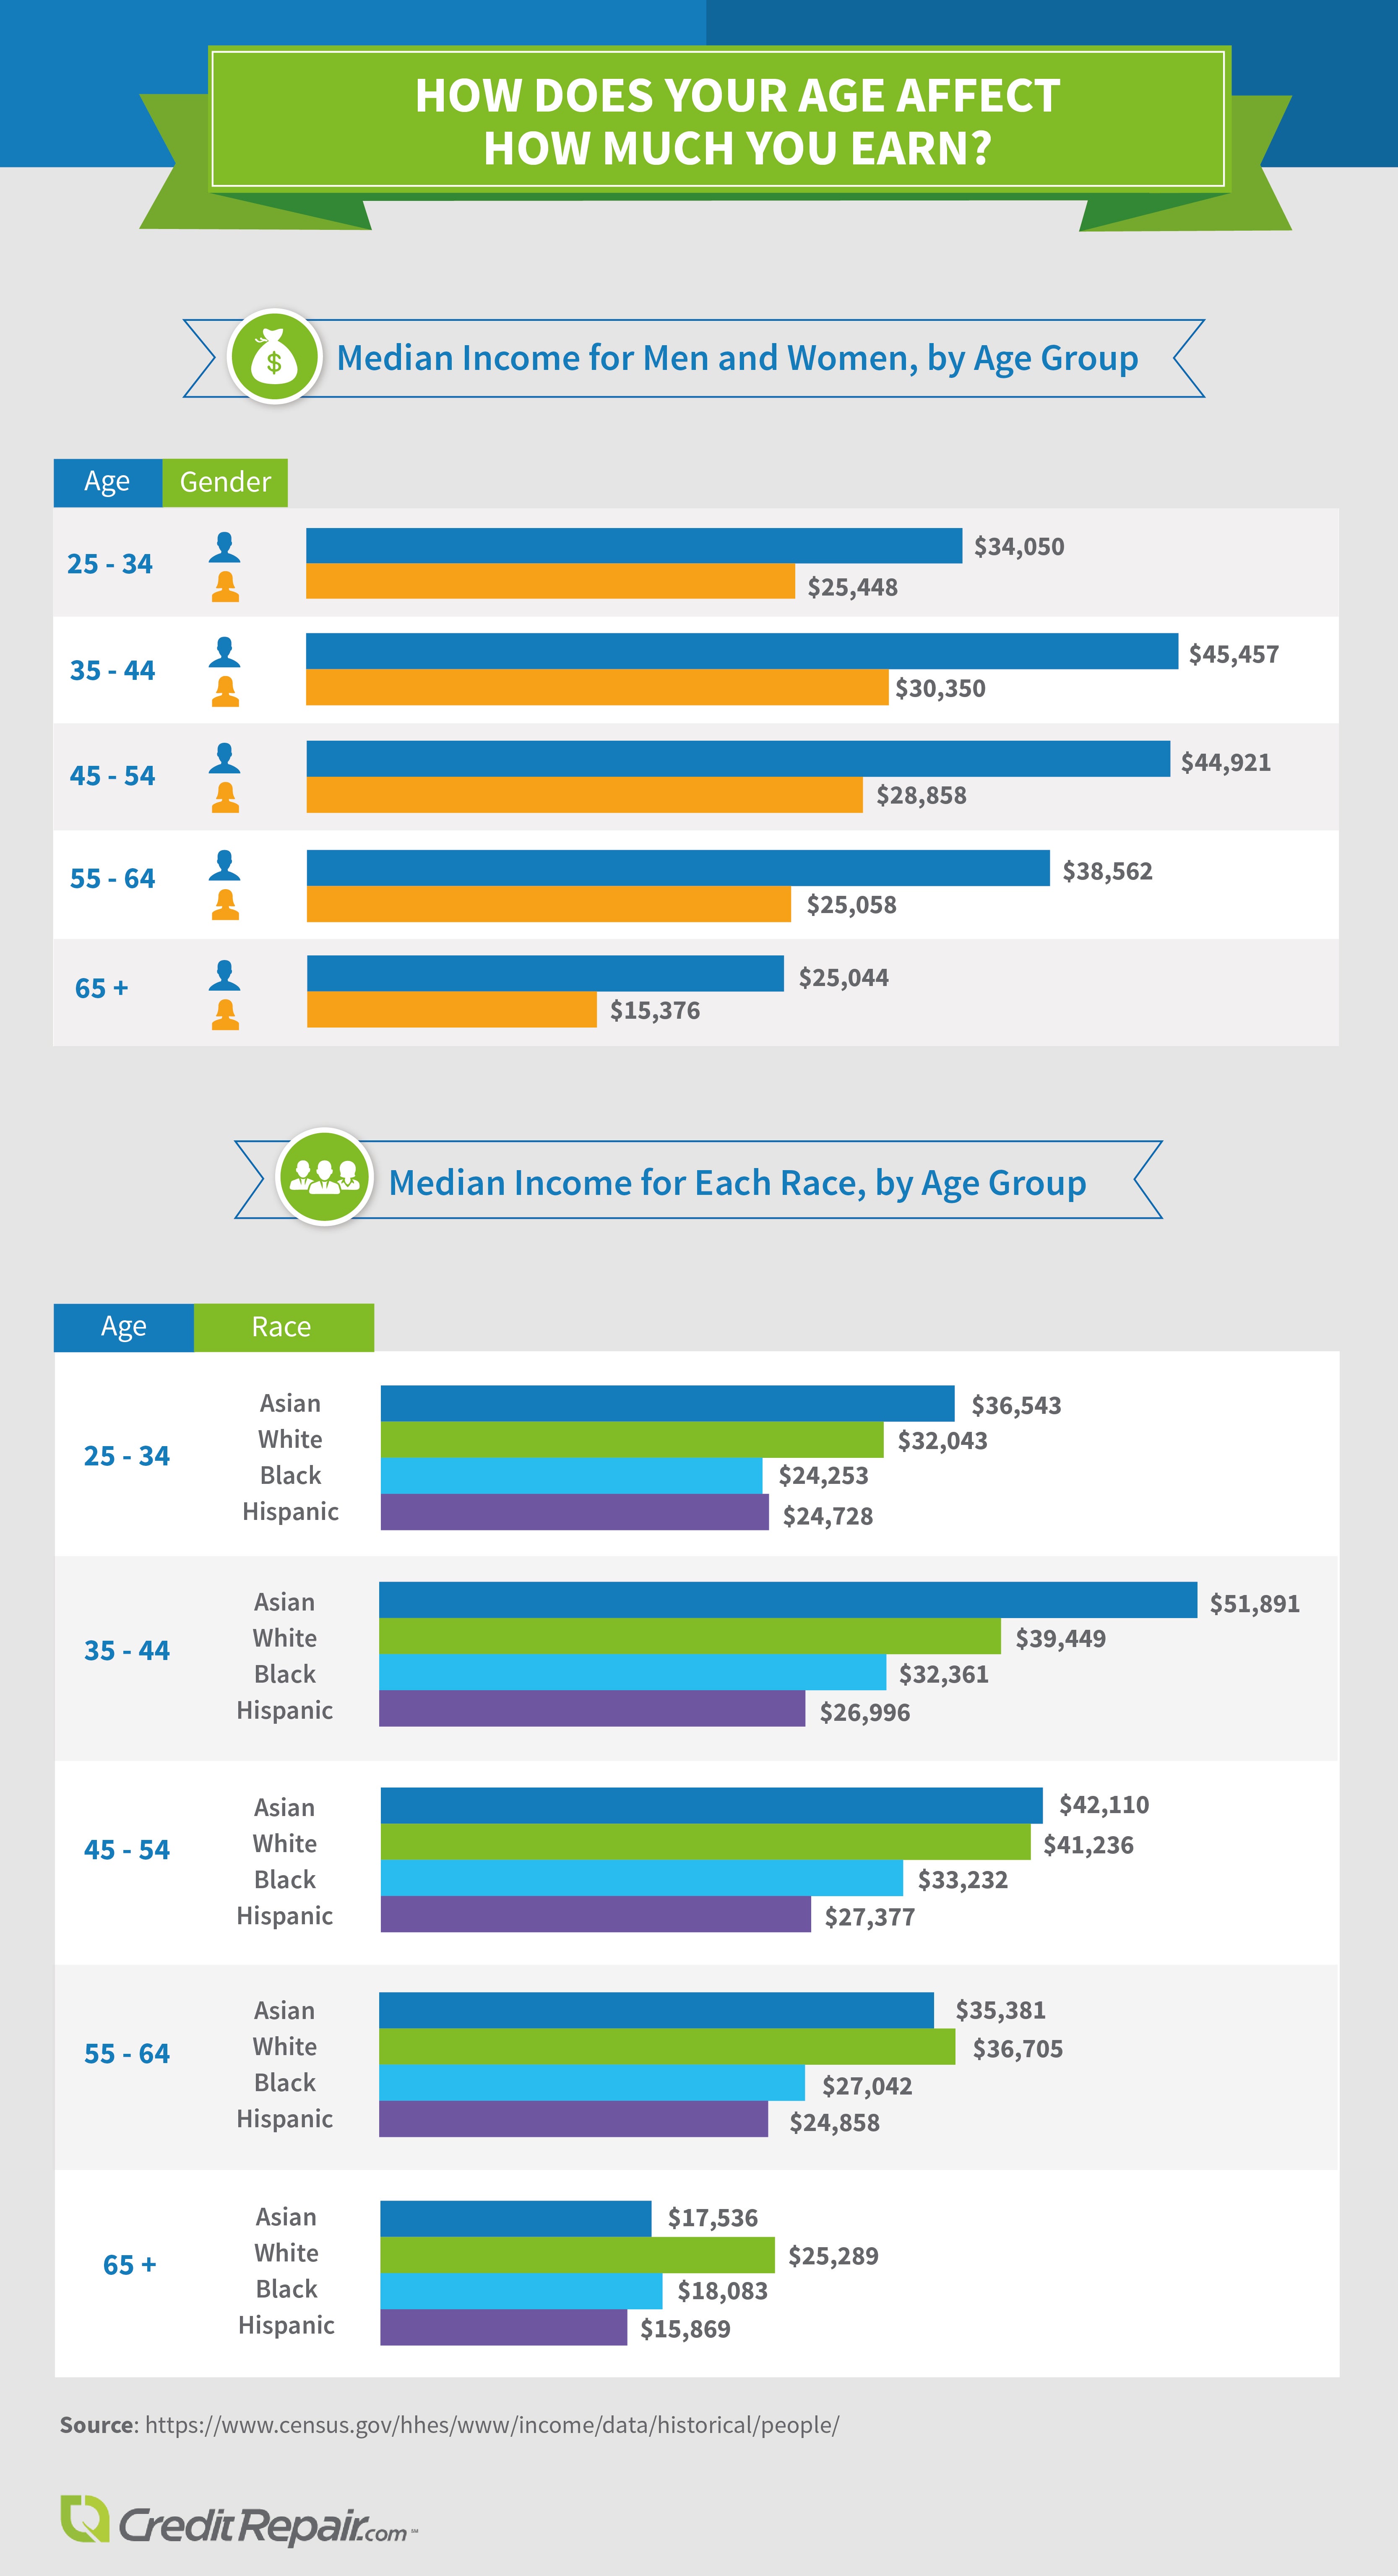
The first myth to dispel is that wealth is reserved for those near the end of their careers, after they’ve climbed their way to the top of the corporate ladder. In reality, median incomes were highest for both men and women between 35 and 44 (with the 45–54 group running close behind) – reinforcing other research that shows men’s salary typically peaks at 48, while women’s tops out nearly a decade earlier at age 39.
It’s also around this time, however, that people are at their least content in life; people aged 40 to 59 are the most miserable on average. Nearly one-third of people in their 40s and 50s contemplate significant career changes that will give them better work-life balance, which may explain why the median income drops for the workforce at age 55 and older.
But age isn’t everything – race is also a major factor in U.S. earning potential, with Asian people outperforming all other races through age 54. The decline for Asian people starting in the 55–64 bracket could be the result of various factors; the disparity observed between first- and second-generation immigrants being one. Asian people age 55 and older who are first-generation Americans are more likely to have lived in poverty and less likely to have been college-educated than their younger, second-generation counterparts.
Median Salaries, by State
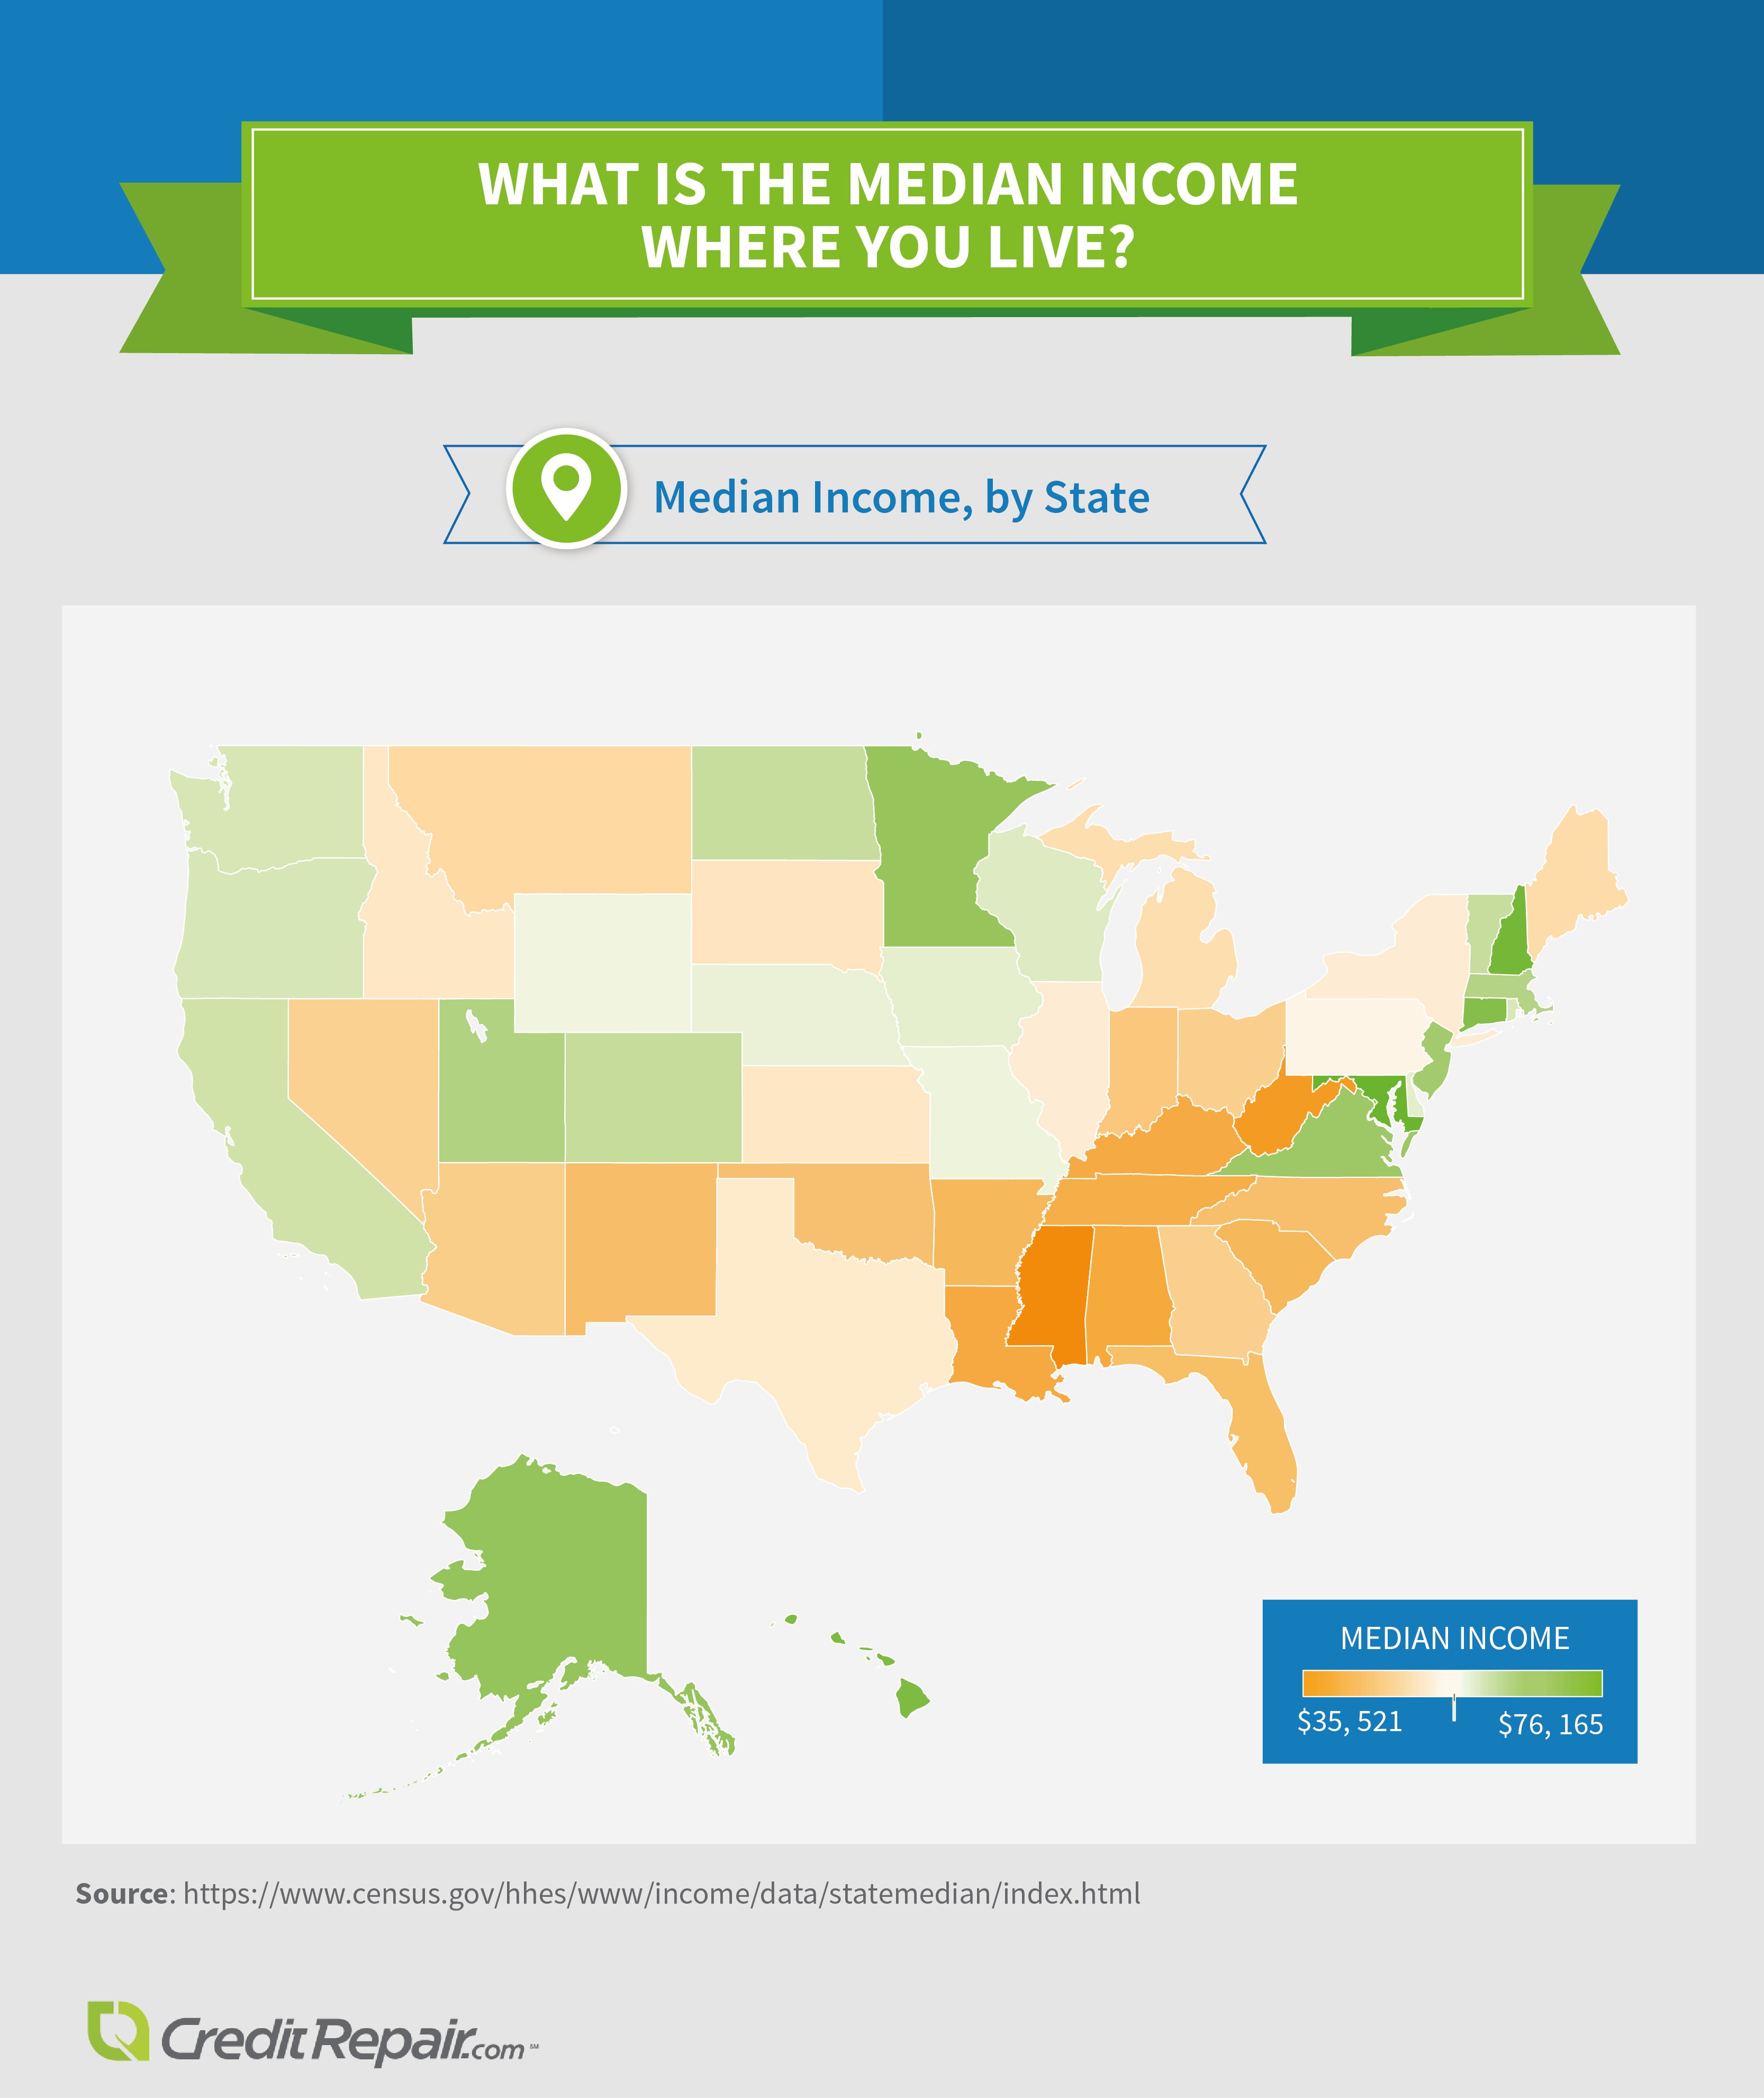
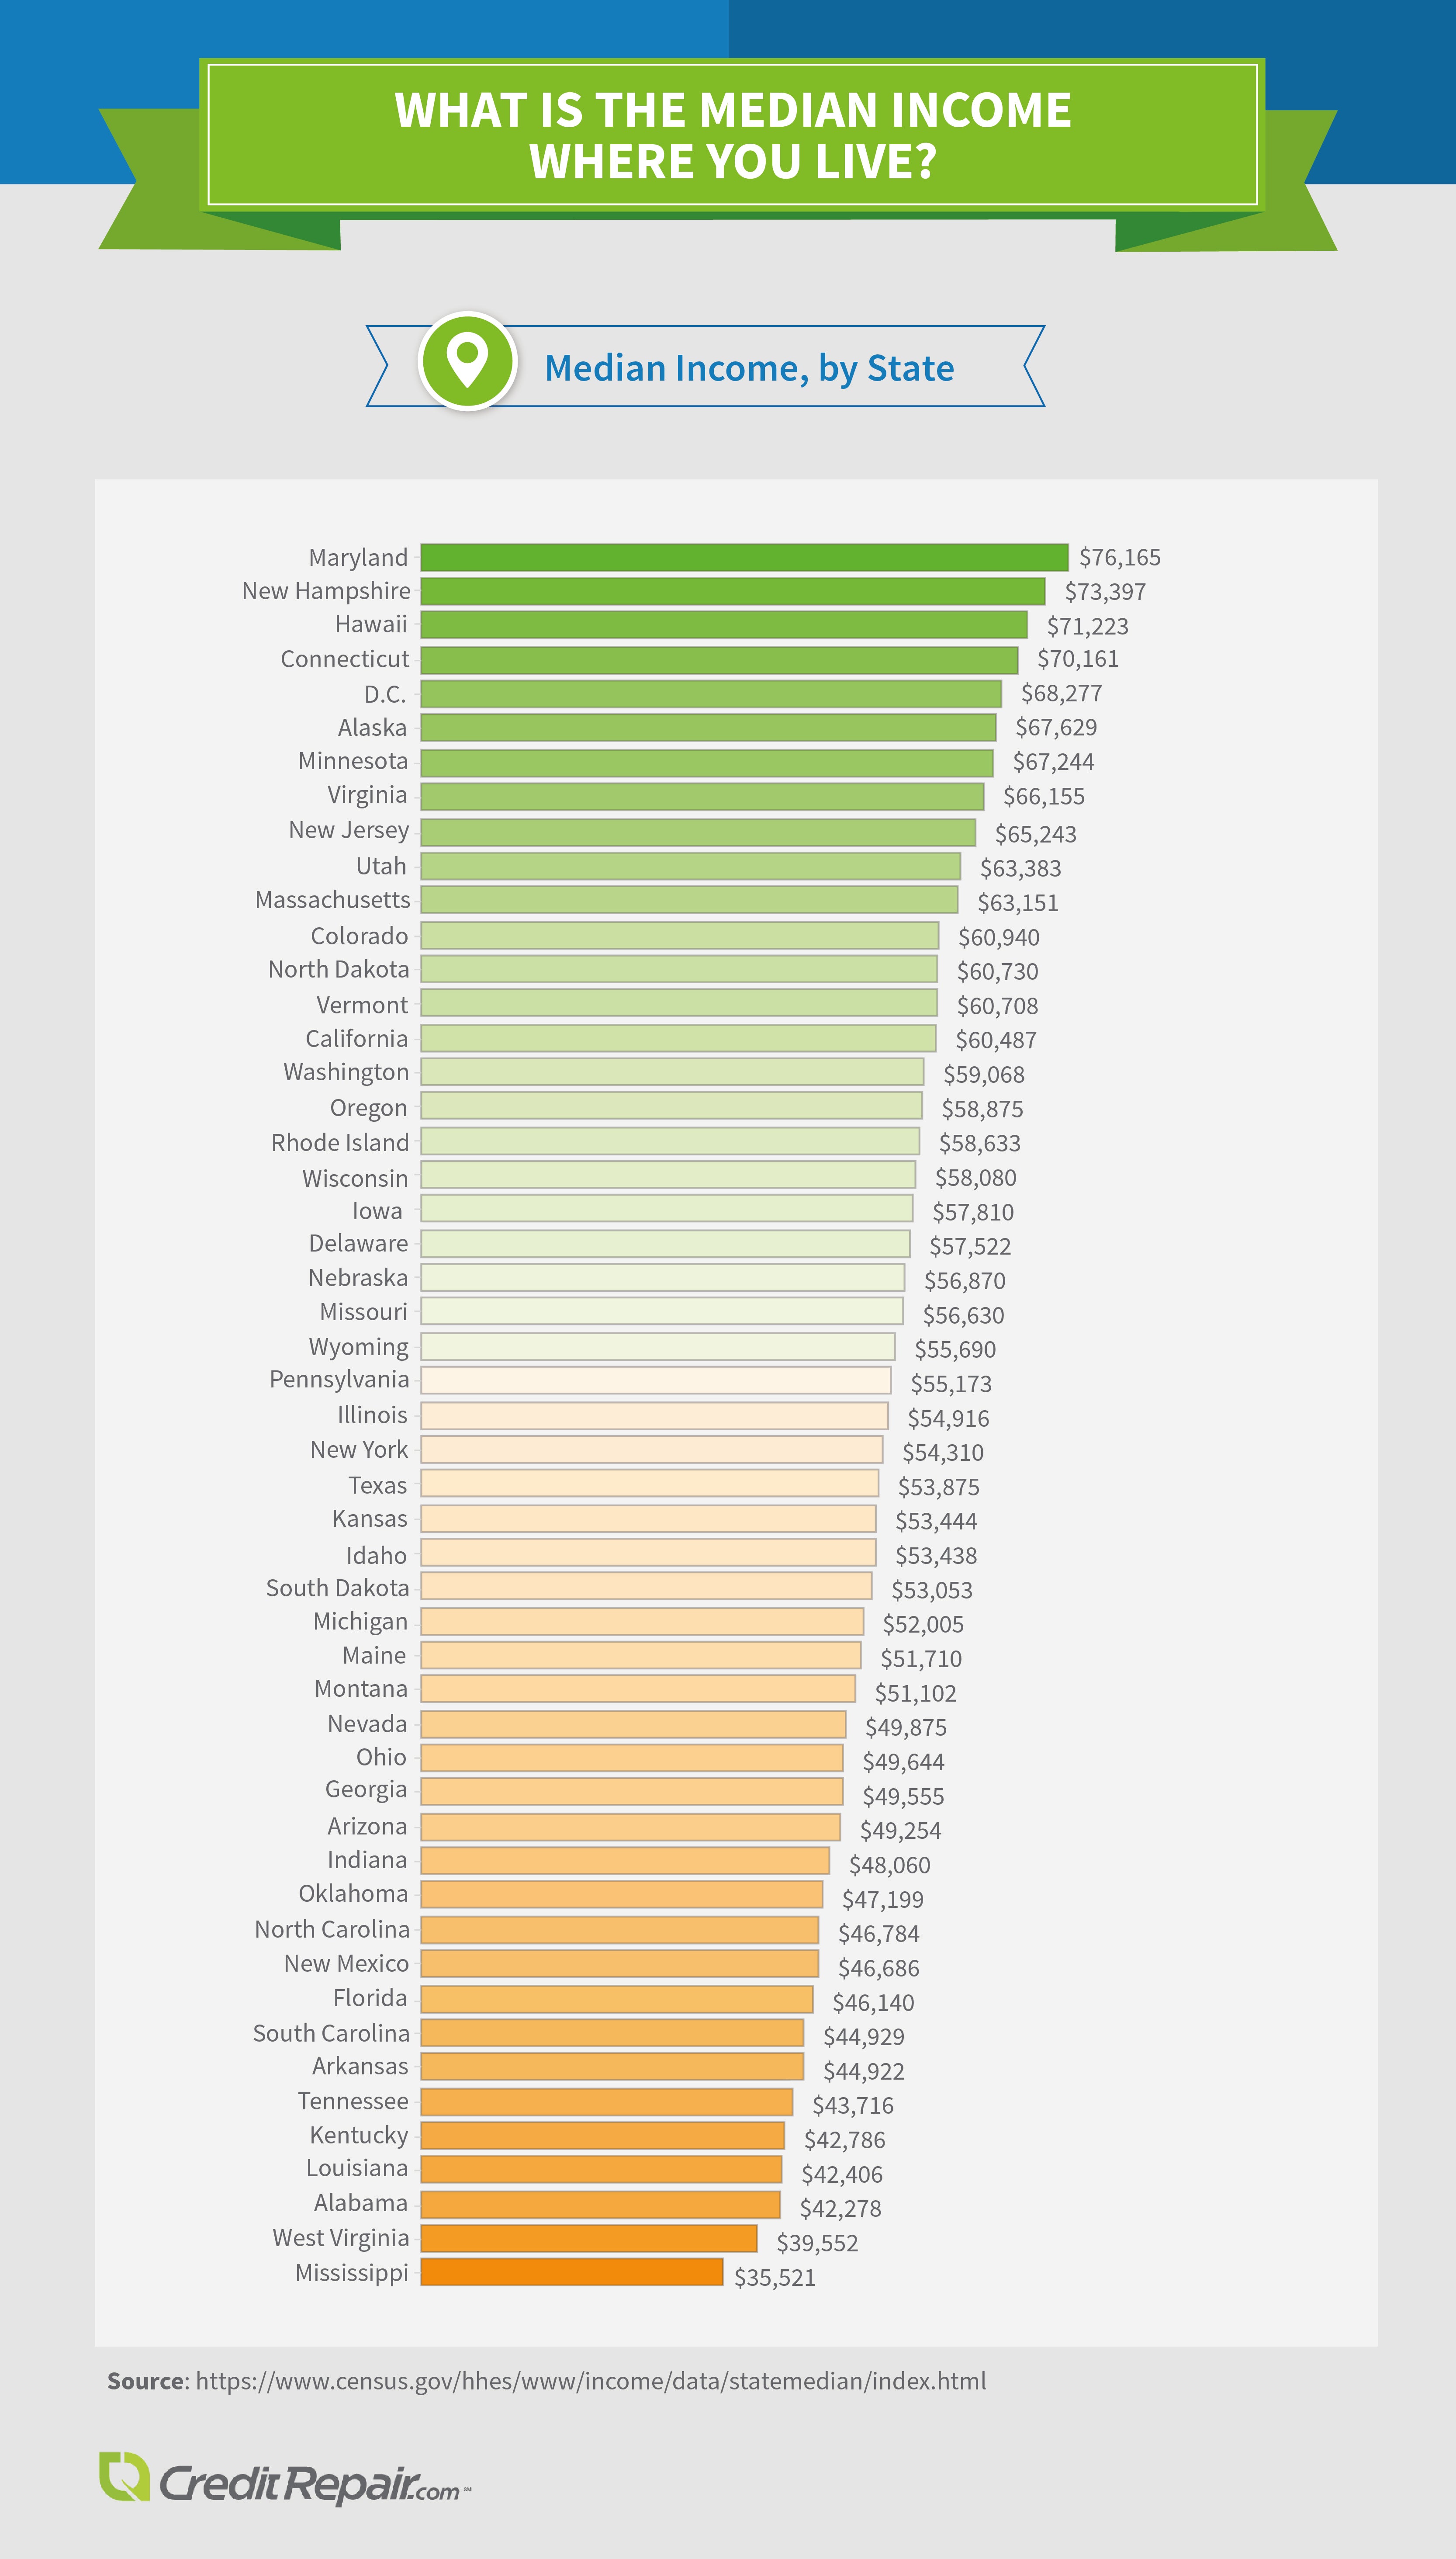
Not accounting for gender, age, and race, it’s clear that income isn’t evenly distributed across the country. Maryland comes in at No. 1, with a median annual income of $76,165. This is in line with findings that the overall Washington, D.C. area is the richest in America, boasting a median income of $90,000 and an average of $74,733 – nearly 80 percent higher than the national average. Maryland’s steep salaries may be influenced by that of the D.C. area and the income of the many political staffers and strategists working there, including members of Congress, who make $174,000 a year.
At the other end of the spectrum, the median income for Mississippi residents is $35,521 a year – over $40,000 less than Maryland’s median salaries. But Mississippi isn’t alone. Nearly every Southern state fell on the low end of the income scale, and they comprised most of the list’s bottom 10. Interestingly, Asian men and women and Hispanic men have a higher median income, on average, in the South than anywhere else in the U.S.
Education and Earning Potential
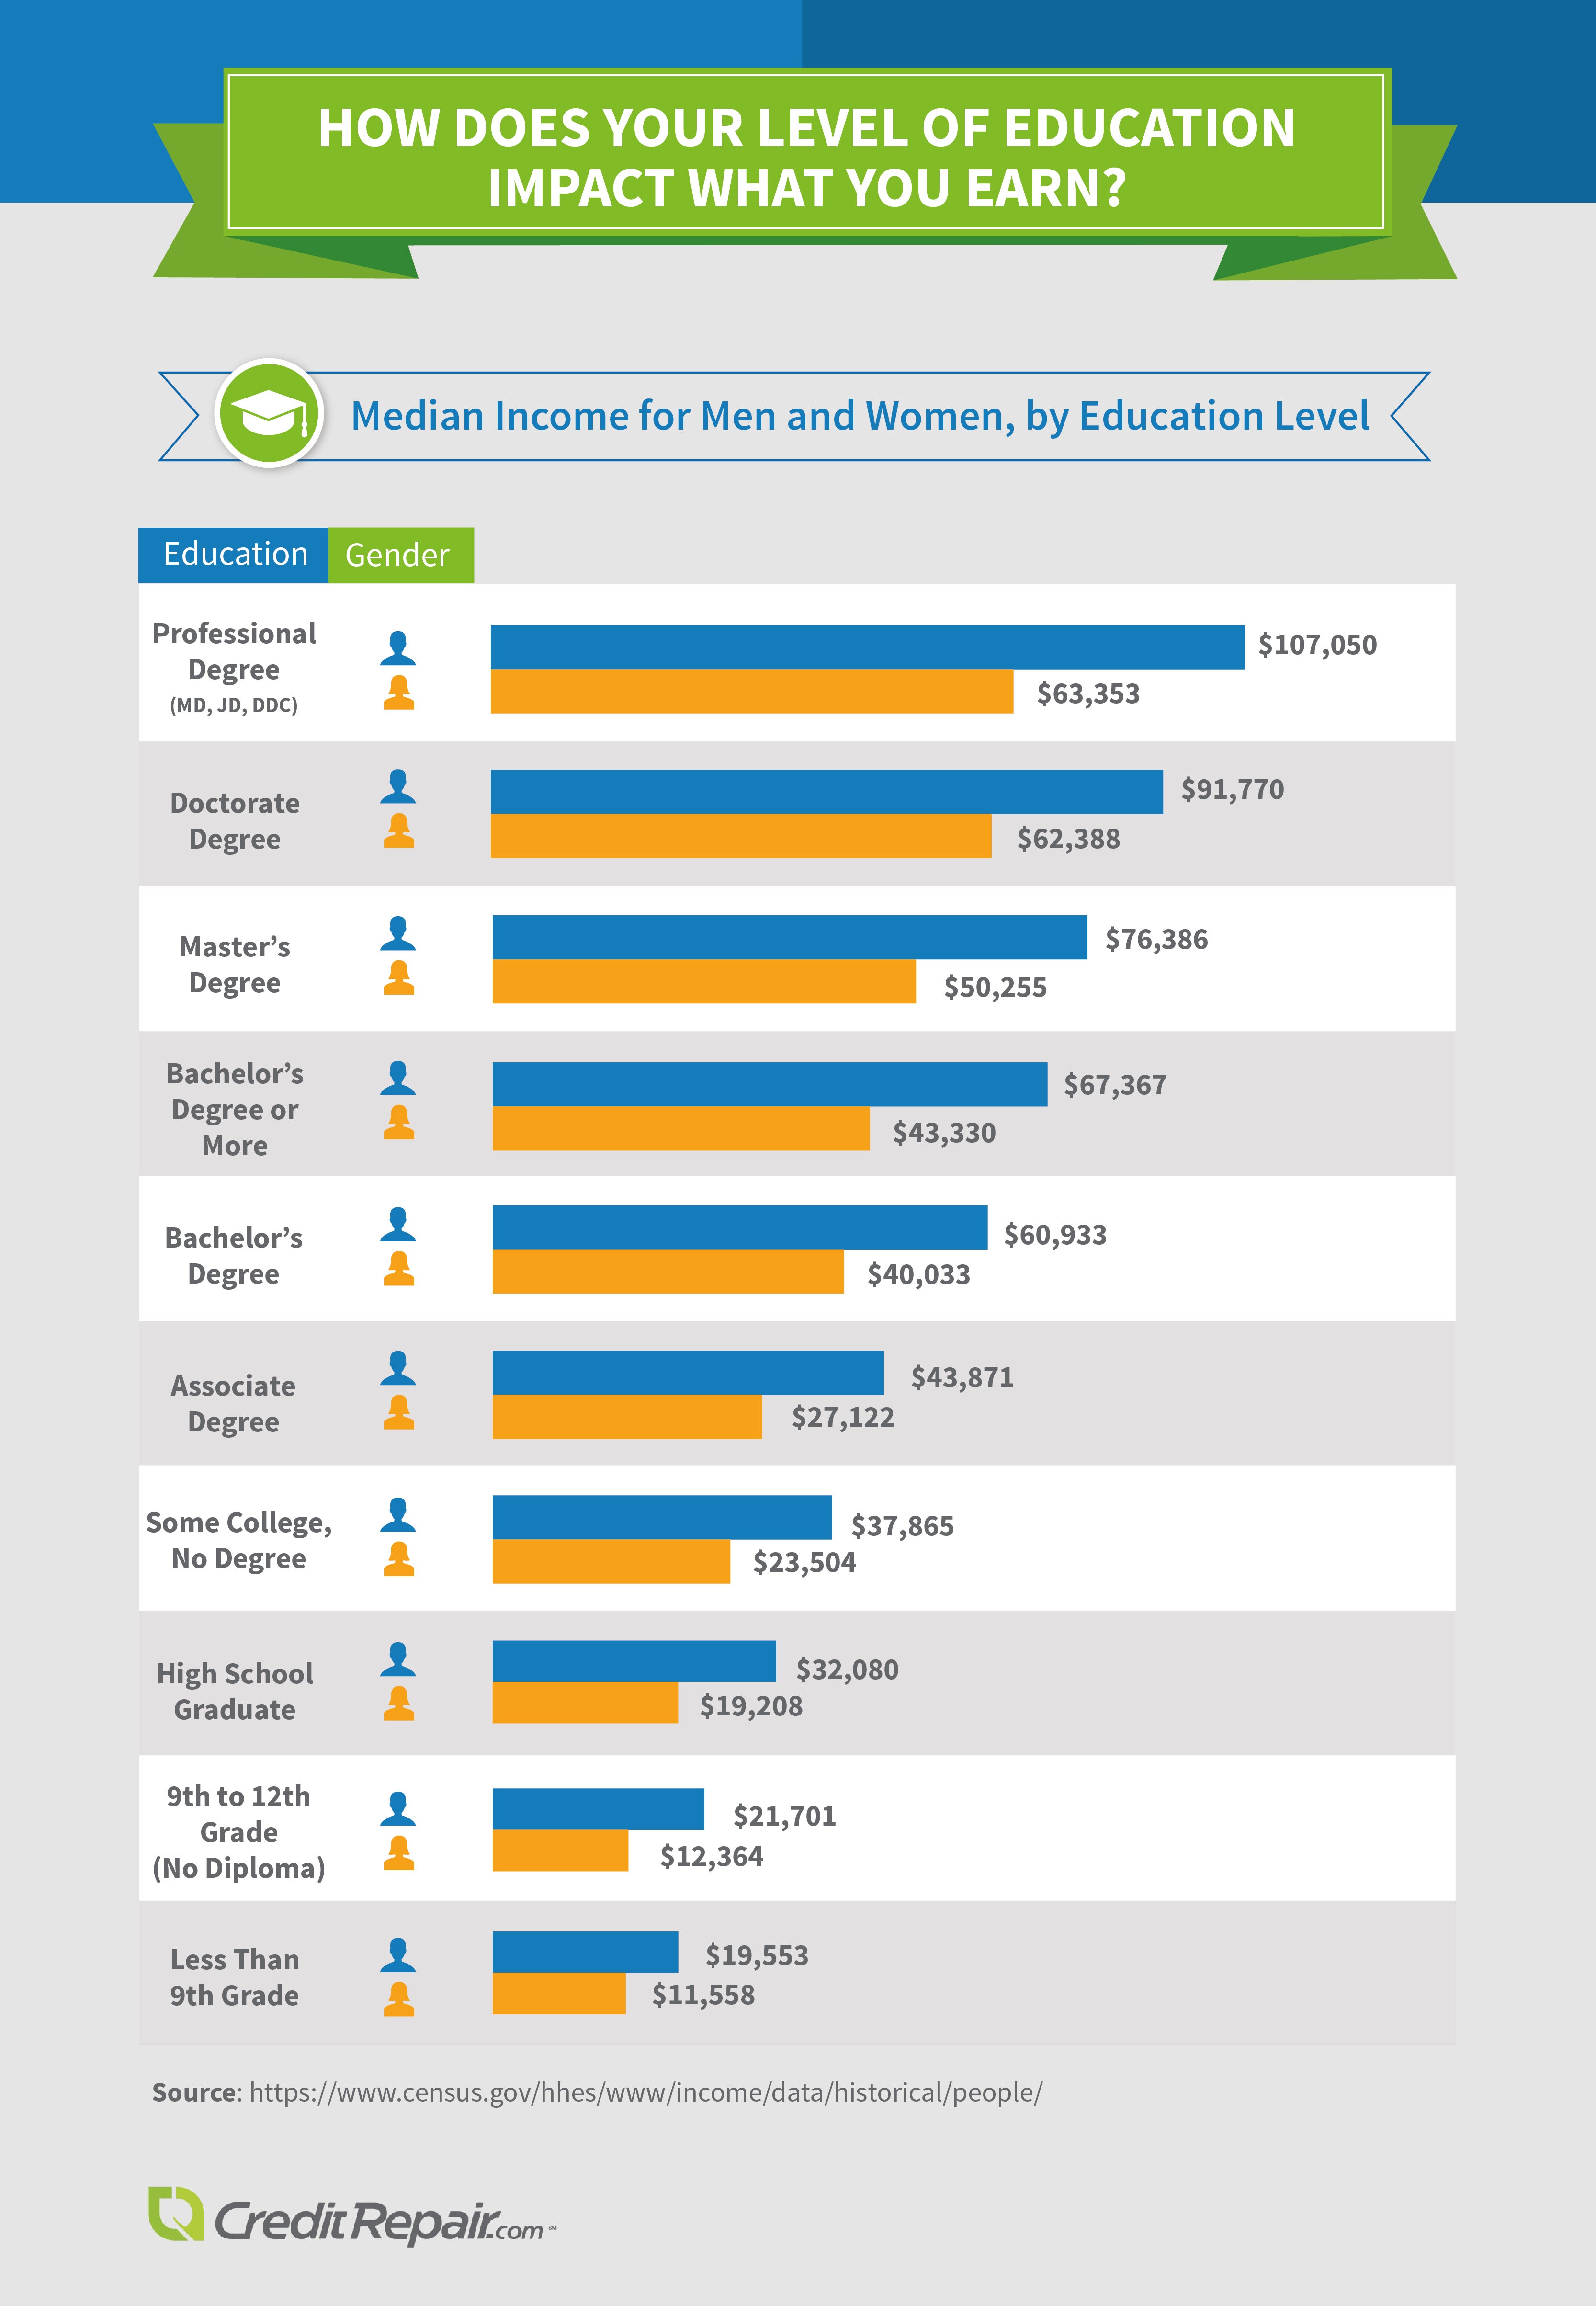
Education level is another variable that can heavily influence an individual’s earning potential. When analyzing the data for the highest level of education achieved – from less than ninth grade to doctorate and professional degrees – it’s clear the median income increased with each additional level of education.
Graduating from high school gives young men an expected wage increase of more than $12,000 a year, and moving from an Associate degree to a Bachelor’s degree boosts women’s annual earnings by nearly $13,000. The gender wage gap is clearly visible when comparing income for men and women with the same educational attainment; the largest disparity is for professional degrees, with women earning $40,000 less per year than their male colleagues.
Overall, women make about 82 cents for every dollar a man does, a statistic that furthers the debate about whether that’s due to discrimination or women’s choices concerning education, career, and family – or a combination of the two. For women with professional degrees specifically, one study found that female medical doctors tended to work fewer hours in lower-paying specialties and see fewer patients per day than men, which affects their bottom line and could partially explain why they make, on average, $10,157 less per year.
Men, Women, and Money
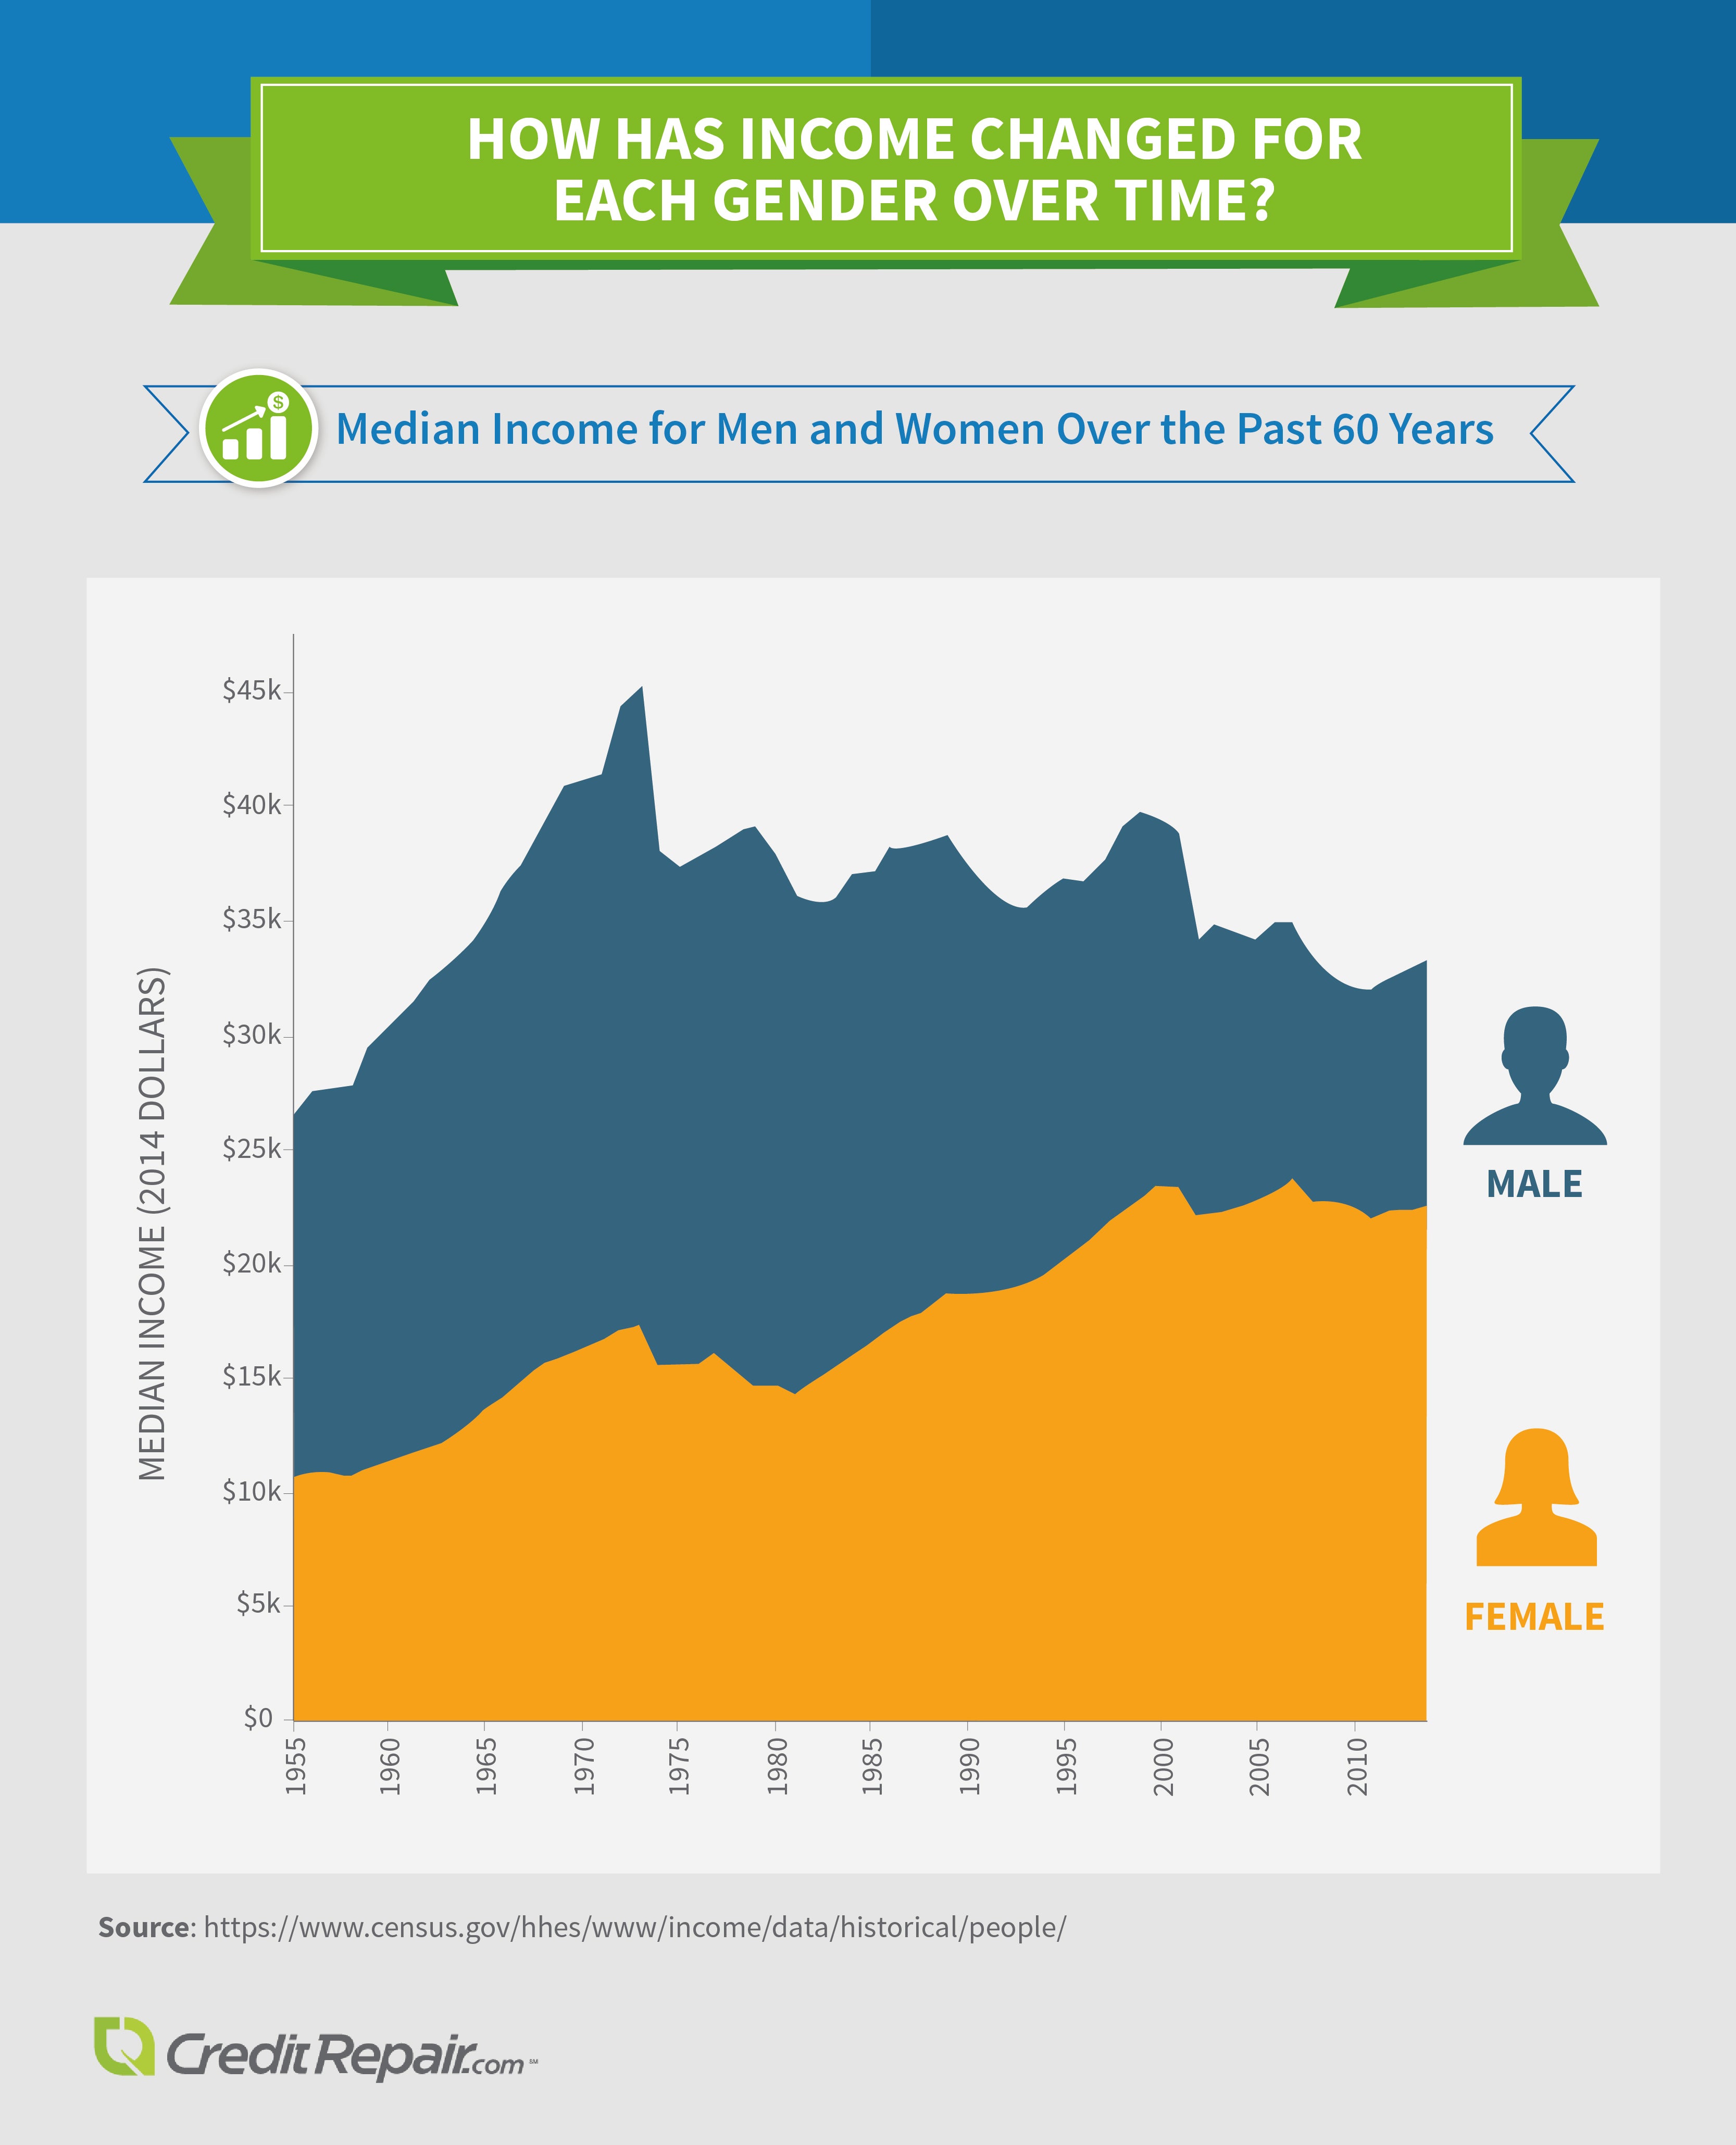
The well-known 78 percent statistic mentioned above is controlled for race (i.e., white women make 78 percent of what white men do). However, when considering women of color, the disparity grows: In 2014, black women made 63 percent of white men did, and Hispanic women earned just 54 percent. This is despite the fact women now outnumber men in universities.
While there is a significance difference in income between genders now, that gap has shrunk over history. In 1973, 10 years after the Equal Pay Act, women’s median income was just 38 percent of men’s. Now, in some areas of the country, the income outlook is decidedly better. In 2014, women in Washington, D.C. made 90 percent of what men did, and seven states (including New York, North Carolina, and Hawaii) are at 85 percent or higher.
Income Over Time
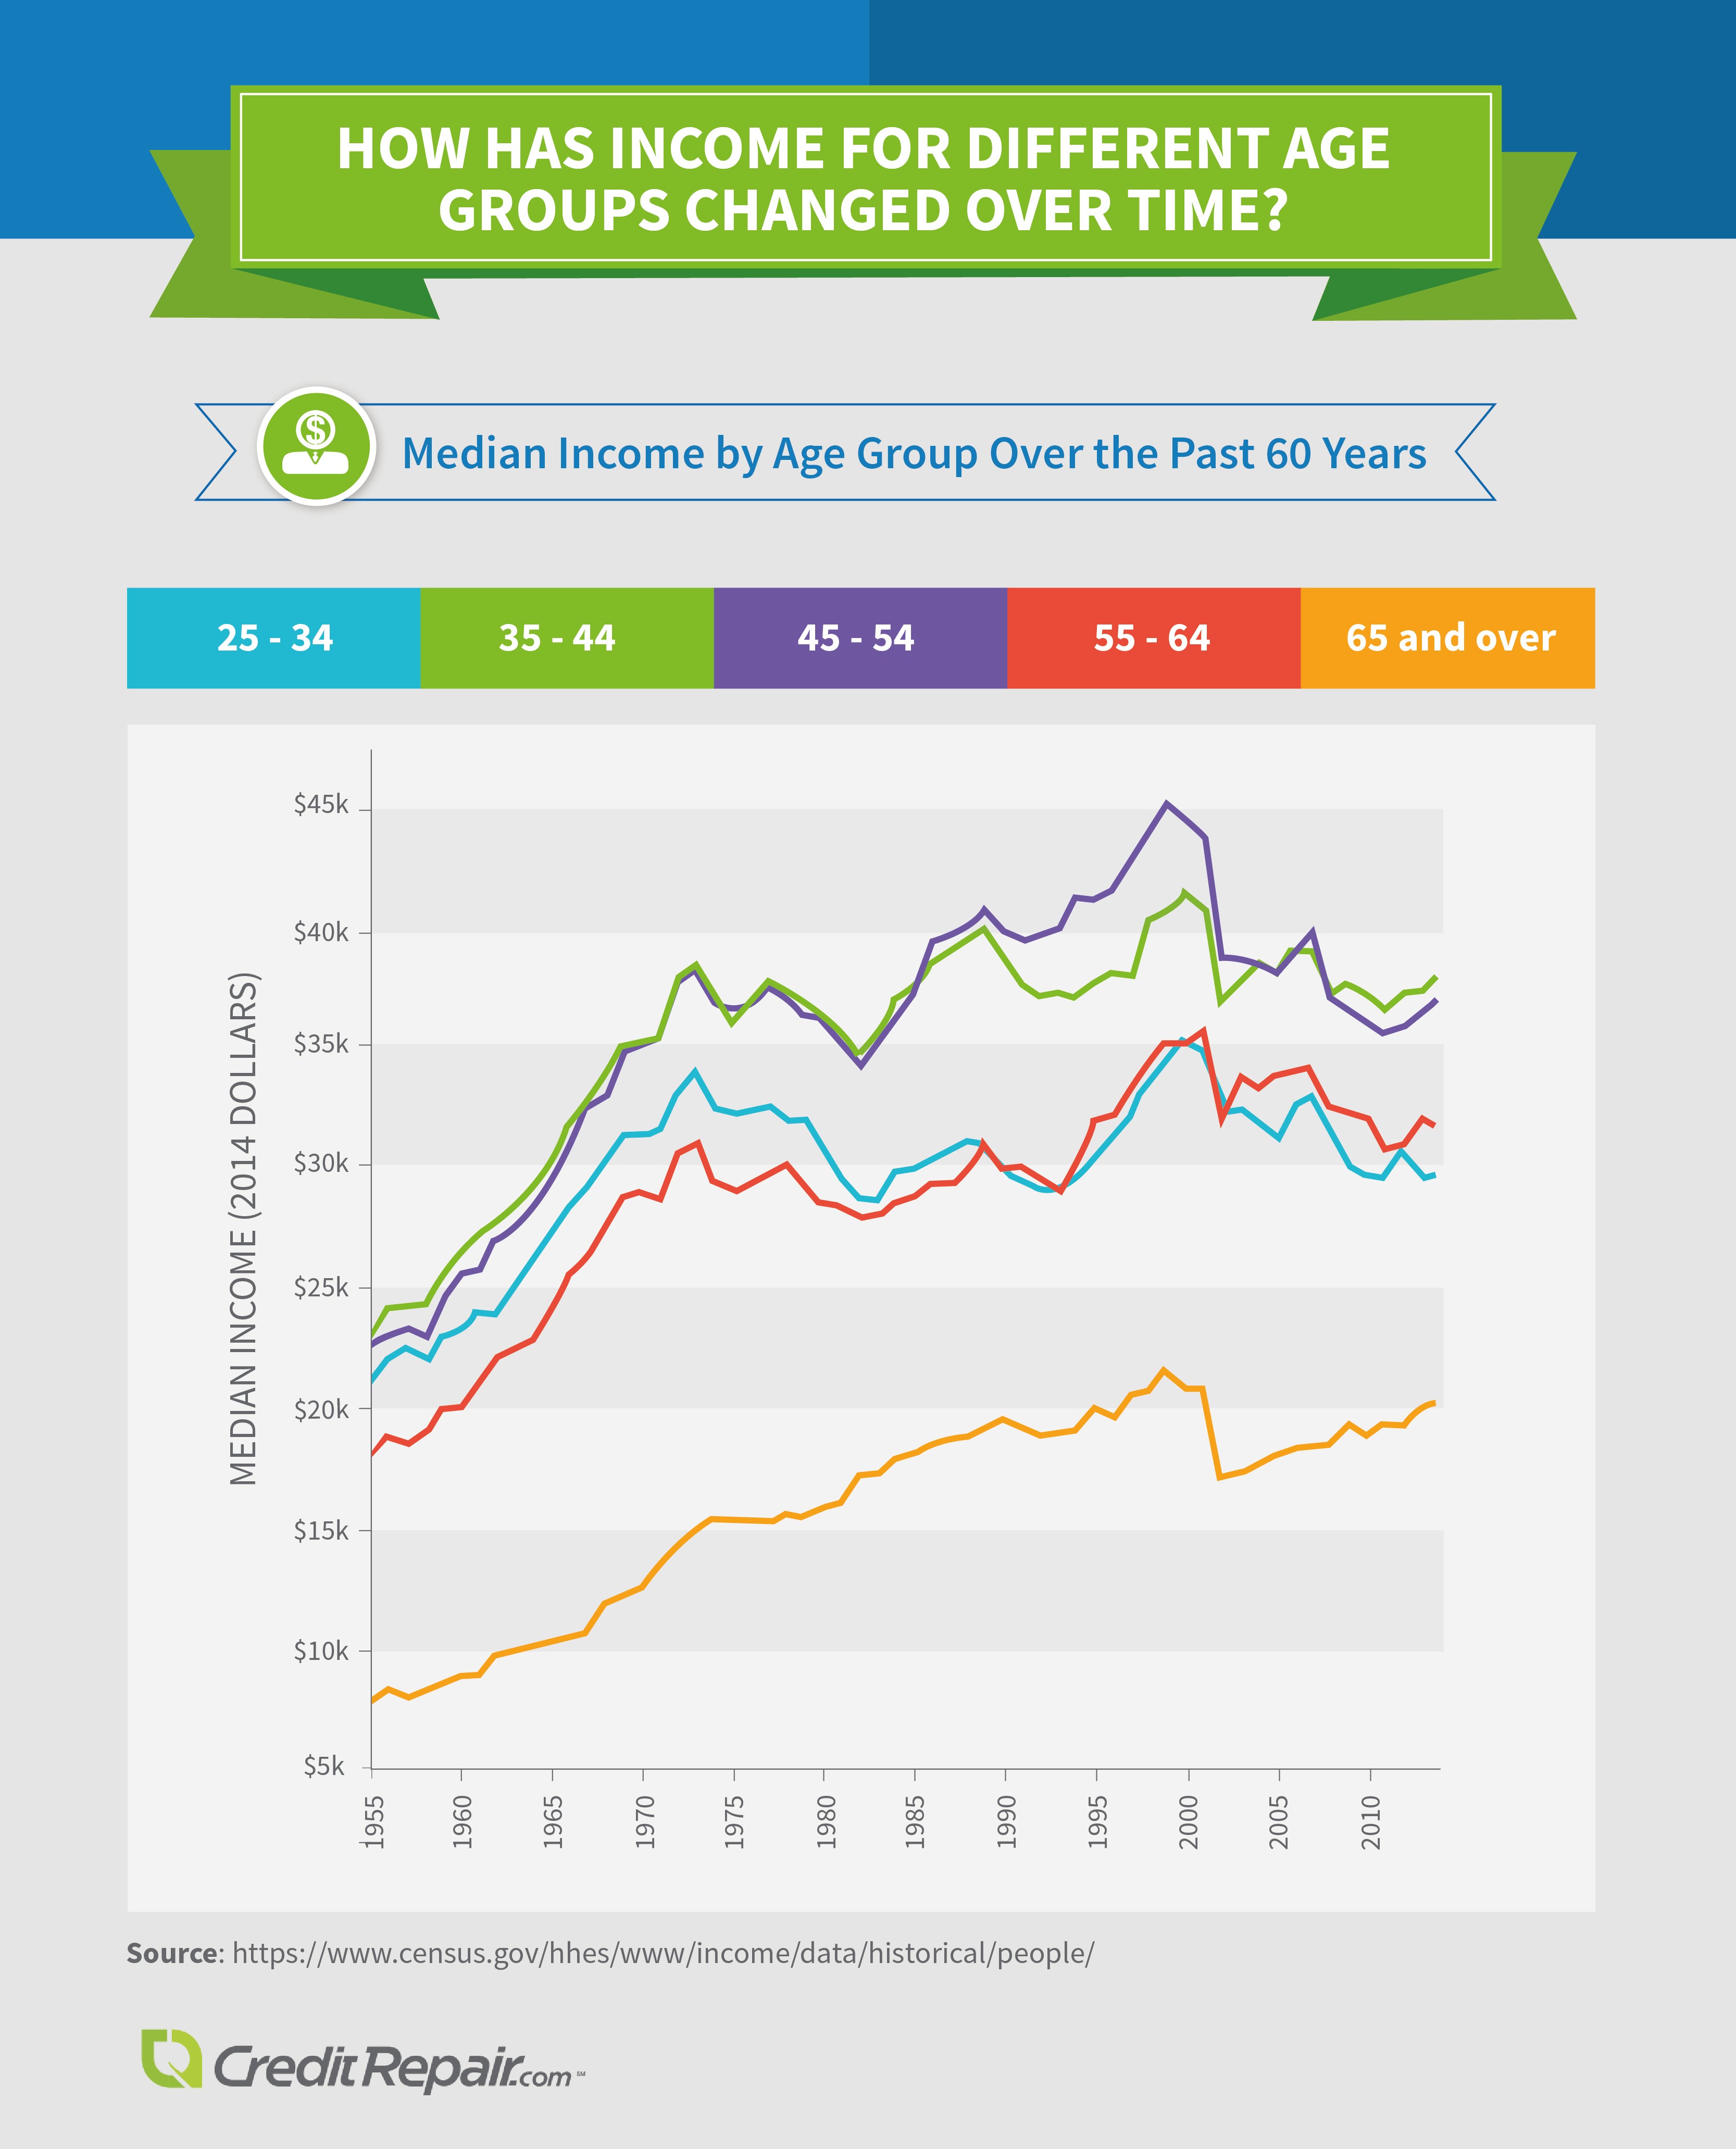
In addition to income being influenced by age, race, and education, it also answers to economic factors such as the state of the stock market and inflation. Reviewing how income for different age groups has changed over the decades, it’s evident all age groups are making more money than they were in the 1950s. However, other periods of time before now don’t show as much progress: The median income of those currently 25–34 years old is the same as their 1968 counterparts, and a 50-year-old would have made $8,000 more per year in 1999 than he does today.
While each age group stays in basically the same spot relative to the others, there have been some surprises over the years. Throughout the 1990s, those age 45–54 surged ahead of the next-lowest age group throughout and recorded the largest-ever median income in U.S. history. The reason for the rise and subsequent fall: the dot-com bubble and its burst, wherein the novelty of Internet retailing drove stocks to dizzying heights only to have them plummet in 2000. Other economic events, such as the downturn of 2002 and the recession of 2008, are also easily visible among all age groups.
Conclusion
Salaries in the United States have risen and fallen over time, and median income differences are seen across various factors including age, gender, race, location, and education level. Most notably, residents of the South, women, Hispanic people, and those 65 and older see a lower median income, on average. While not all aspects of a person’s life can be changed to increase his or her income, moving to a new region or state or furthering one’s education level are two actions that can be taken.
Methodology
We analyzed the United States Census Bureau’s historical tables for median income. We pulled and compared income by age, education level, race, gender, region, and state. All income levels are based on a 2014 dollar value. All the interactive features are based on 2014 Census data.
Fair Use Statement
We grant permission to use the images found on this page freely. When doing so, we ask that you kindly attribute the creators by linking to this page so your readers can learn more about the project and its methodology.
CreditRepair.com’s goal is to not only educate you about your credit, but to help repair it as well.
Carry on the conversation on our social media platforms. Like and follow us on Facebook and leave us a tweet on Twitter.
Sources
https://www.census.gov/hhes/www/income/data/historical/people/
http://www2.census.gov/geo/pdfs/maps-data/maps/reference/us_regdiv.pdf
https://www.census.gov/hhes/www/income/data/statemedian/index.html
https://www.businessinsider.com/people-earn-the-most-in-their-40s-2015-7
http://www.usatoday.com/story/money/personalfinance/2014/06/29/retirement-life-reimagined-usa-today-survey/11135523/
http://www.pewsocialtrends.org/2013/02/07/second-generation-americans/
https://www.breitbart.com/big-government/2014/09/19/boomtown-dc-region-has-highest-median-household-income/
http://www.npr.org/sections/itsallpolitics/2014/04/04/299078253/congressmans-lament-174-000-isnt-enough-to-make-ends-meet
http://www.civilwar.org/education/history/primarysources/secessionacts.html#VIRGINIA
https://www.whitehouse.gov/sites/default/files/docs/equal_pay_issue_brief_final.pdf
http://www.marieclaire.com/career-advice/news/a15311/gender-pay-gap-hospital-doctors/
http://articles.chicagotribune.com/2013-09-03/lifestyle/sns-rt-us-gender-income-20130903_1_average-female-doctor-female-doctor-researchers-jena
https://www.eeoc.gov/laws/statutes/epa.cfm
http://www.aauw.org/research/the-simple-truth-about-the-gender-pay-gap/
http://time.com/3741681/2000-dotcom-stock-bust/
https://money.cnn.com/2002/07/19/news/crash2002/
https://money.cnn.com/2014/08/27/news/economy/ben-bernanke-great-depression/
http://www.theguardian.com/society/2016/feb/02/middle-aged-people-least-happy-most-anxious-ons-wellbeing-report
Questions about credit repair?
Chat with an expert: 1-800-255-0263